First I heard about ElasticSearch being a software engineer at a governmental organization. I didn’t have a chance to work with it at that time. All I knew about it was that it’s a search engine that works somewhat similar to its popular alternatives.
Yet, this technology captured my attention and I promised myself to find a job that would allow me to learn it in depth. That’s how my ElasticSearch journey began.
Now, after years of work with ElasticSearch on different engagements, I’d like to share the lessons learned with those who want to use the ELK stack for building data pipelines and data analytics solutions.
Elasticsearch for cybersecurity analytics
I got my first experience with ElasticSearch in a cybersecurity tech company. My team applied Elasticsearch Logstash Kibana (the ELK stack) in cybersecurity analytics. The architecture of our ELK project looked as follows.
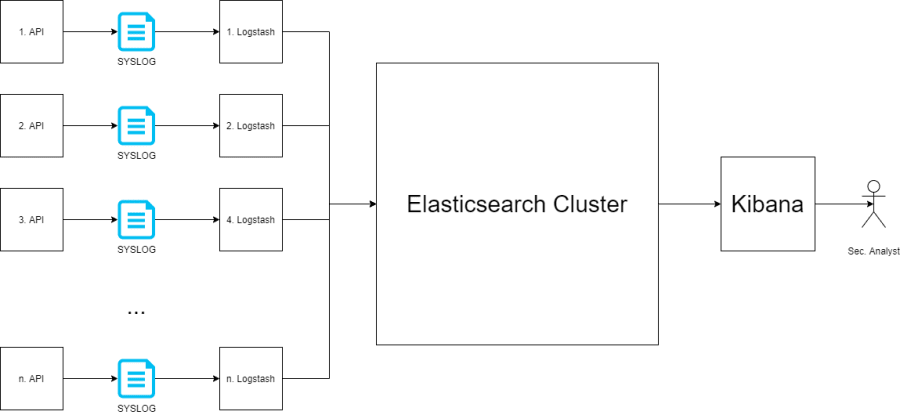
The stack worked with a Spring Boot microservice that was collecting cyber intelligence information from our company’s cybersecurity products. The data was collected in a System Logging Protocol (SYSLOG) file. Logstash red the SYSLOG file line by line and transferred the data to ElasticSearch. Bi-weekly, a cybersecurity analyst would analyze the collected data using Kibana, created visualizations and dashboards.
At first, our ELK system processed data pulled from one cybersecurity product. Our ElasticSearch cluster had nine nodes: three master-eligible and six data nodes installed on Digital Ocean. We regularly had to deal with Elasticsearch red status (means unavailable), because of Digital Ocean’s policy: “When an Instance is using swap shut it down”. Digital Ocean was a startup at that time, and I hope they have changed this policy since then.
With time, the maintenance became more and more difficult. A new product was going to be added to the data pipeline. Hence, we decided to move our cluster to Amazon ElasticSearch Service. The switch helped us resolve the maintenance problem, and our team could finally focus on other tasks at hand.
ElasticSearch for humanitarian aid tracking
My next ELK project was at a company that developed solutions for non-governmental organizations (NGOs) providing humanitarian aid, such as UNICEF, IFRC, and others. The company used ELK stack for building a business intelligence (BI) module for its web application. The whole management and maintenance of this module were on me.
NGOs managed their humanitarian initiatives as separate project and used our BI module to analyze their activities. For each project, a single platform was deployed and maintained. Each platform had a BI module that was activated if an NGO needed it.
The data collected in an ELK stack went through a pipeline starting from a relational database system MySQL/Aurora and finishing at an ElasticSearch instance. The pipeline was created in three steps:
- Create a database query
- Configure Logstash
- Create a scheduler for Logstash
The steps seem to be simple but maintaining them was a real problem because the number of projects/platforms for every NGO was growing. We faced two challenges:
-
Consistency. The query result should be consistent with other modules’ results, especially the numbers shown on reports.
-
Reliability. The data pipeline should be always working (reliable) or the numbers stood behind the numbers shown in other reports.
Not to mention calming down customers, who panicked every time the numbers on reports were not equal…
The ELK stack used by the company had a single Elasticsearch node (a standalone mode). When the ElasticSearch crashed and data corruption occurred we couldn’t recover the data and had to reset the data pipelines. Luckily, this did not affect other modules. We would inform the support team about the problem and solved this by restarting the data pipelines every time such corruption occurred. Resetting the data pipeline required three steps:
- Stop data pipeline
- Delete the pointer file that denotes the last transferred tracking info
- Start data pipeline
To fix the problem, we decided to update the business intelligence module and let it create the pipelines and dashboards automatically using the powerful RESTful API feature of Kibana and ElasticSearch.
ElasticSearch for logging
The third use case for ElasticSearch concerned log management. I developed a solution for an organization that wanted to collect data from child organizations to analyze their customers’ behavior. The insights obtained from the data helped the organization improve its services. Below you can see the architecture of this project.
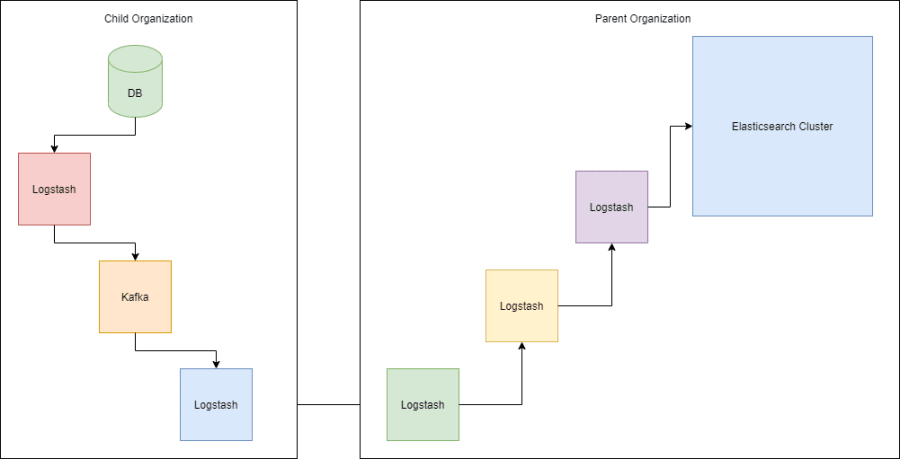
The parent organization provided the main data pipeline stacked as Logstash -> Kafka -> Logstash -> ElasticSearch. The child organizations had the same data pipeline but without ElasticSearch. They used Kafka for providing a recovery option in case of data pipeline failures. The only challenge for this project was maintaining the model of the data structure.
Some of the child organizations would not comply with the model, which led to some problems with sharding data. Sharding means slicing the data into chunks so that clustered/distributed database systems could distribute the chunks across working nodes.
Shard failures would not allow creating visualizations and dashboards, which was crucial for this project. We had to replace the receiving Logstash of the main data pipeline with a RESTful API. This solution helped us to filter the wrong data from the pipeline and report to the parent organization.
Lessons learned from working with the ELK stack
I used ElasticSearch for BI purposes: log analytics, cybersecurity analytics, and customer behavior analytics. Each domain had specific data structures but all used data pipelining. Having coped with various challenges, I made the following conclusions about the ELK stack and its components:
-
The ELK stack is difficult to maintain and requires automation.
-
The ELK stack is expensive and requires a dedicated team for deployment, upgrading, and maintenance.
-
The ELK stack is more powerful and stable when multiple nodes are available due to its distributed architecture.
-
You should avoid standalone mode at any cost unless other data recovery options are available.
-
Beats is the lightweight version of Logstash, because of its simplicity.
-
Kibana changed drastically in four years and space management is its best feature.
-
Every new technology introduced by elastic.co improves drastically.
-
Developing ELK stack integrations with Python, especially in data transfer operations, is easier than with Java or Logstash.
-
Combining Kafka and the ELK stack gives powerful buffering.
-
If you need the model of the collected data to have a strict structure, then you should put a RESTful service in front of the ELK stack.
Data analytics is crucial for business process improvement and planning. Creating reliable and automated data pipelines will always be in demand. To succeed, you should choose the right ELK architecture for different problem domains, otherwise, you risk wasting a lot of time and resources.
ElasticSearch is still improving and can be considered one of the best options for creating data pipelines and data analytics. I believe in the near future ElasticSearch will become much easier and cheaper to maintain in distributed environments.